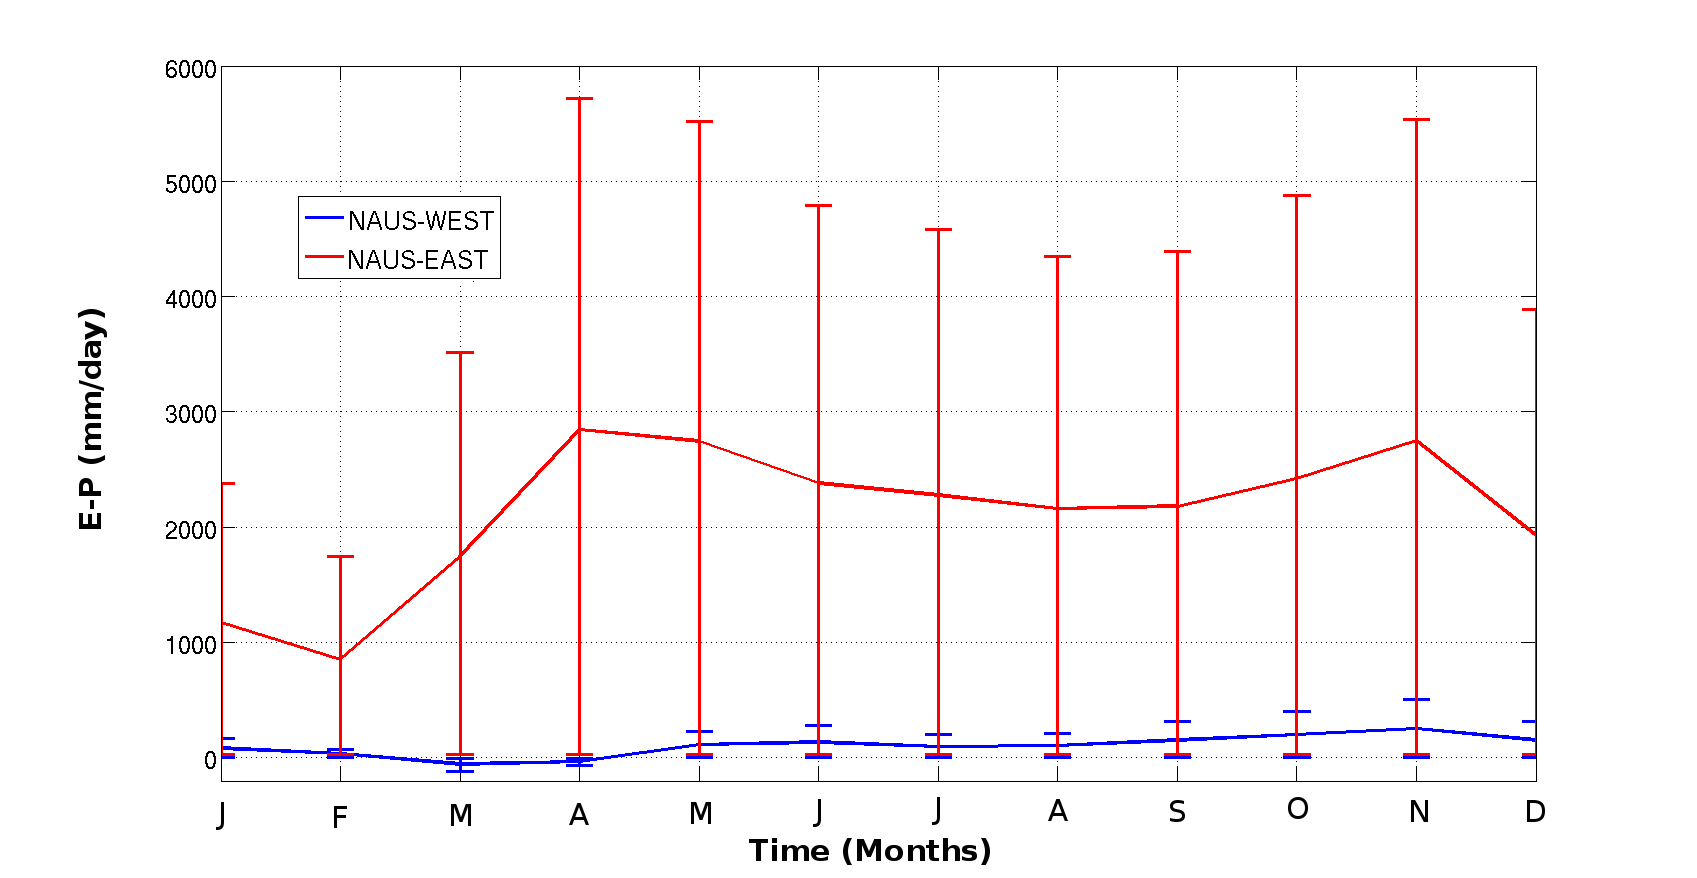
Averaged annual values of (E-P)1-10 and bars of standard deviation (±σ) for the NAUS CCR associated with its moisture sources: Northwestern Australia (blue line, NAUS-WEST) and Northeastern (red line, NAUS-EAST).
Averaged annual values of (E-P)1-10 and bars of standard deviation (±σ) for the NAUS CCR associated with its moisture sources: Northwestern Australia (blue line, NAUS-WEST) and Northeastern (red line, NAUS-EAST).