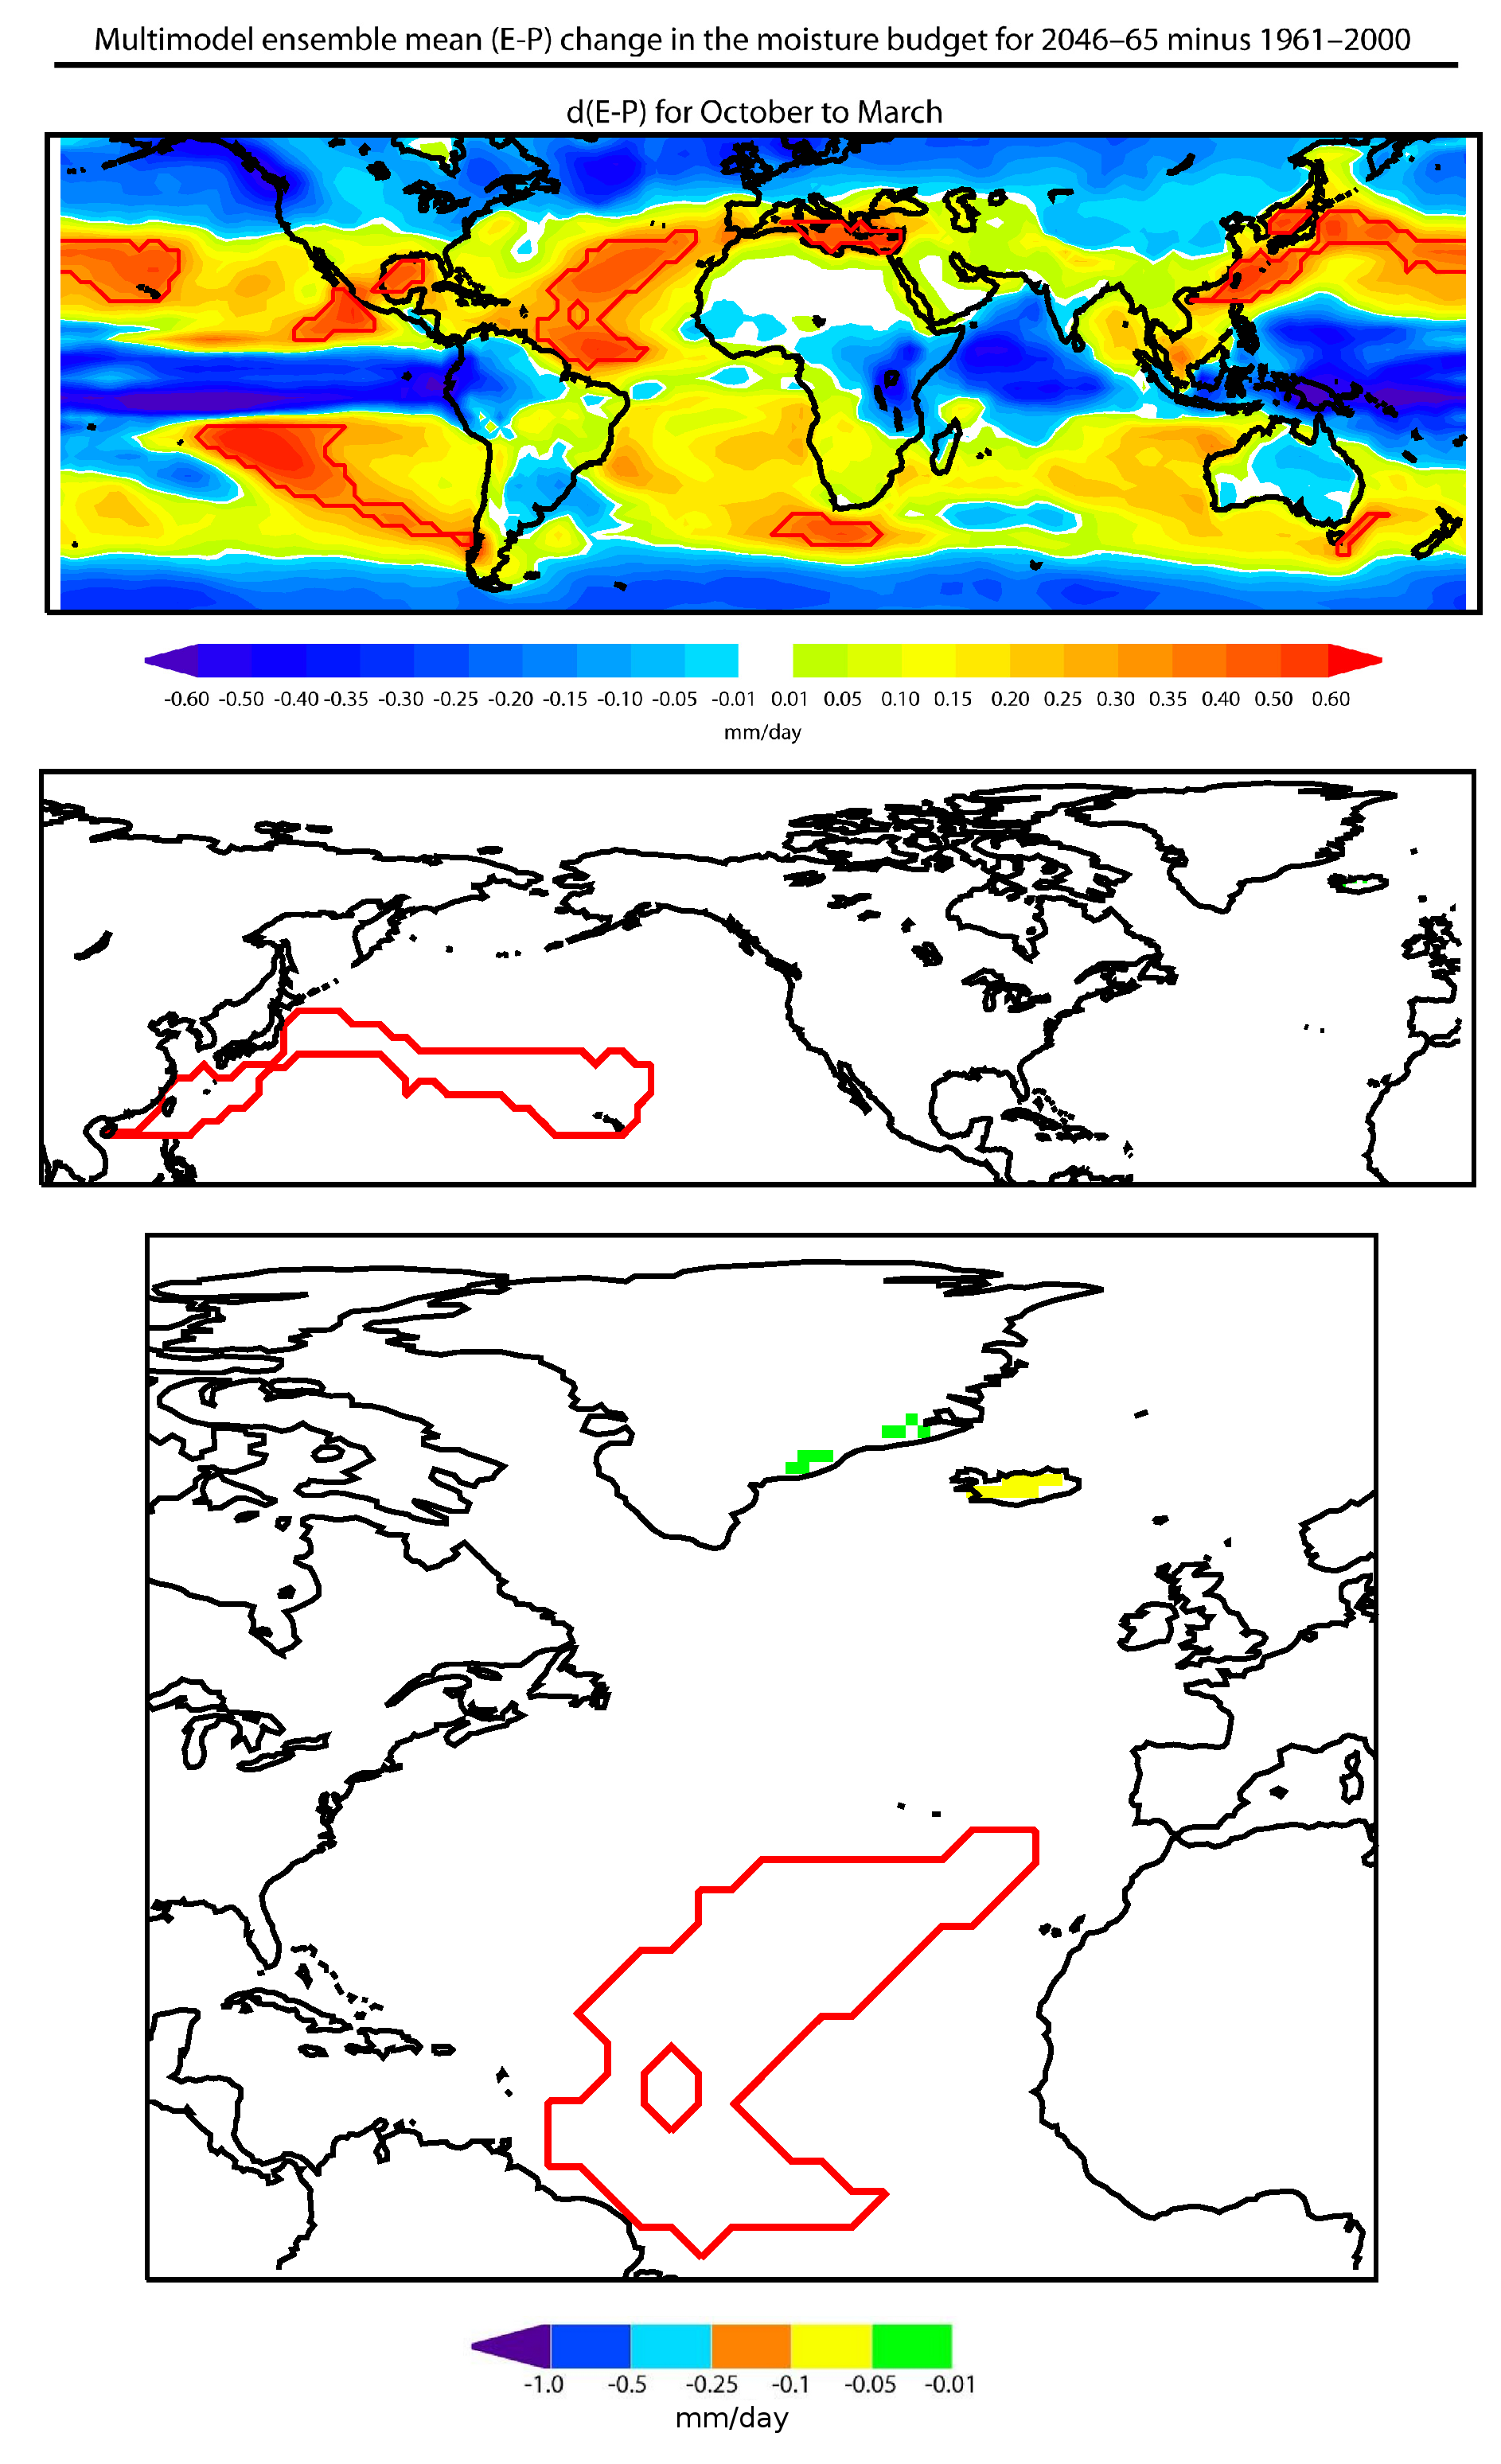
(top) Multimodel ensemble mean (E-P) change in moisture budget for October to March 2046-1965 minus that for 1961-2000. Data provided by Richard Seager [Seager et al., 2010].
(2nd, 3rd, bottom) (E-P) values integrated over 10 days for the period October to March 1980-2012 for the CCR, calculated by forward tracking the FLEXPART model from the hot spot moisture source (indicated by the closed red line). Only those negative values less than -0.01 mm/day are plotted.