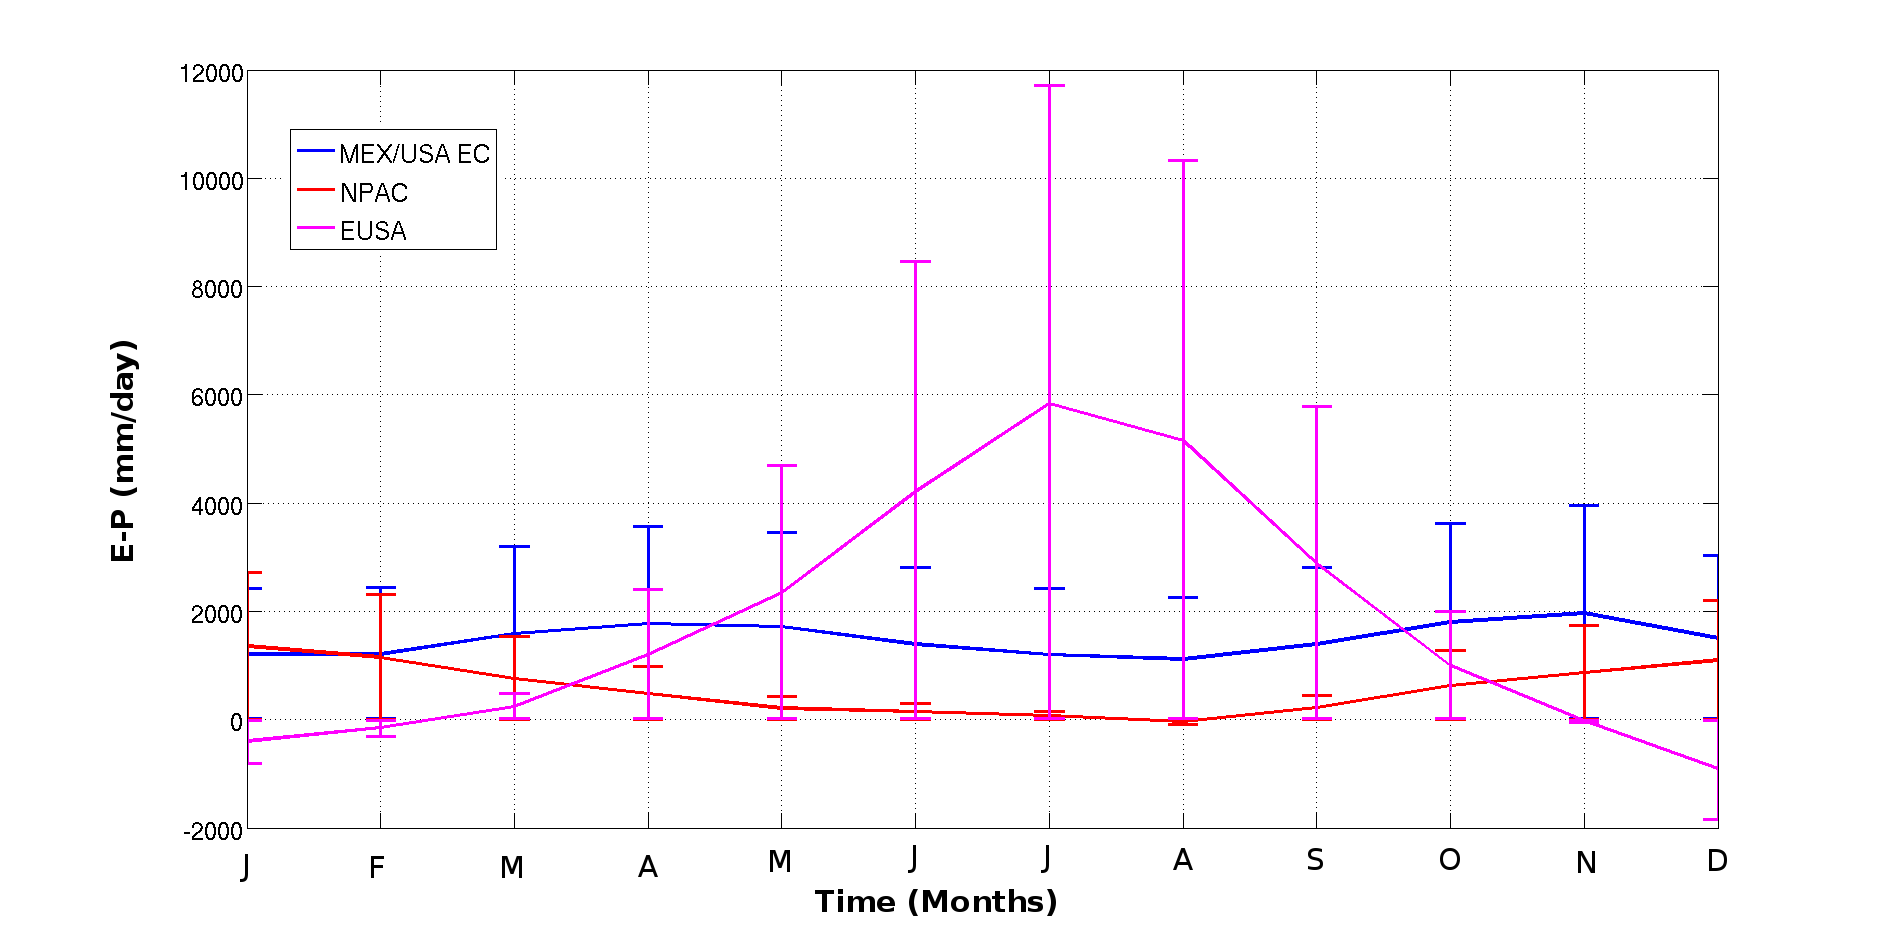
Averaged annual values of (E-P)1-10 and bars of standard deviation (±σ) for the MENA CCR associated with its moisture sources: Mexico/USA Eastern Coast (blue line, MEX/USA EC), North Pacific (red line, NPAC) and Eastern USA (magenta line, EUSA).
Averaged annual values of (E-P)1-10 and bars of standard deviation (±σ) for the MENA CCR associated with its moisture sources: Mexico/USA Eastern Coast (blue line, MEX/USA EC), North Pacific (red line, NPAC) and Eastern USA (magenta line, EUSA).